Today Footprint
| Monte Cimone | Bologna | San Pietro C. | |
|---|---|---|---|
| 00 |  |
 |
 |
| 06 |  |
 |
 |
| 12 |  |
 |
 |
| 18 |  |
 |
 |
Tomorrow Footprint
| Monte Cimone | Bologna | San Pietro C. | |
|---|---|---|---|
| 00 |  |
 |
 |
| 06 |  |
 |
 |
| 12 |  |
 |
 |
| 18 |  |
 |
 |
CO
| Monte Cimone | Bologna | San Pietro C. |
|---|---|---|
 |
 |
 |
Dust
| Monte Cimone | Bologna | San Pietro C. |
|---|---|---|
 |
 |
 |
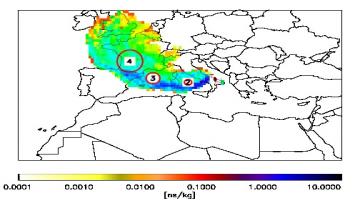
It represents the residence time of the released back-plume over each grid bin. Colours hence indicate the regions where the air masses are spending the most time during the previous 4 days, and therefore highlights which source regions may affect more likely the receptor measurement site. The red circles indicate the position of the center of mass of the cluster each 24 hours back in time. Their dimensions give an indication of the particles dispersion around the barycenter of the cluster
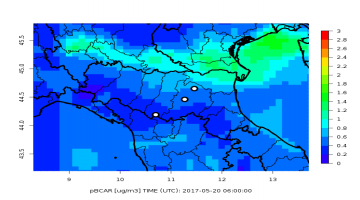
Coupling the footprint (time units) with emissions inventories (mass * time-1 units) and integrating over the geographical domain covered by the plume, is possible to reconstruct the potential contribution of each source region to the concentration of the species that will be observed at the measurements site. We use here EDGAR and RETRO inventories for the CO species and DREAM for Dust.